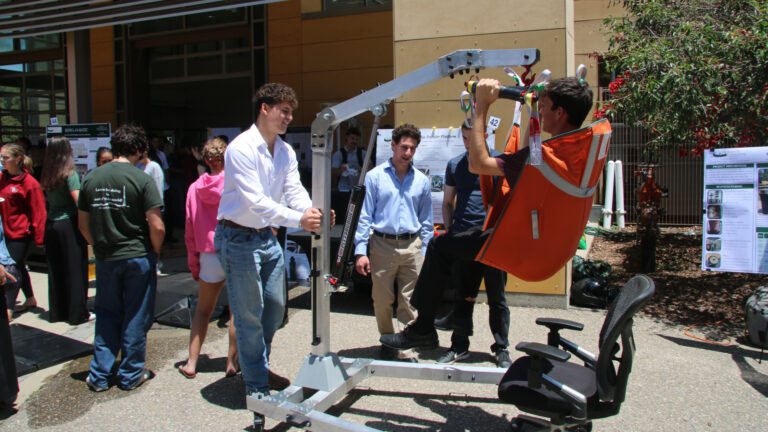
As industry emphasis on big data has increased, Cal Poly’s IME department has been keeping up by adding data analytics courses and hiring student data analytics technicians to support their peers’ projects and course work. When COVID-19 pushed classes online, the data analytics technicians, senior industrial engineering majors Carson Hubred and Harrison Koos, began to brainstorm creative solutions to ensure students could continue to hone their data expertise. The result was a plan for data analytics competitions where undergrad and graduate students compete for cash prizes and department notoriety.
“In previous quarters, being a data analytics technician focused on providing students help via office hours and in-person presentations or networking events with industry experts. This quarter we decided to go in a whole new direction, and I think it has made the IME data analytics program more successful and engaging than ever,” said Hubred.
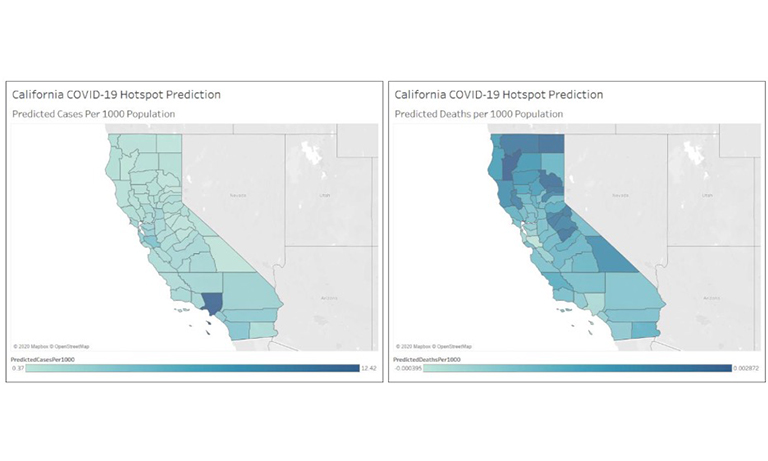
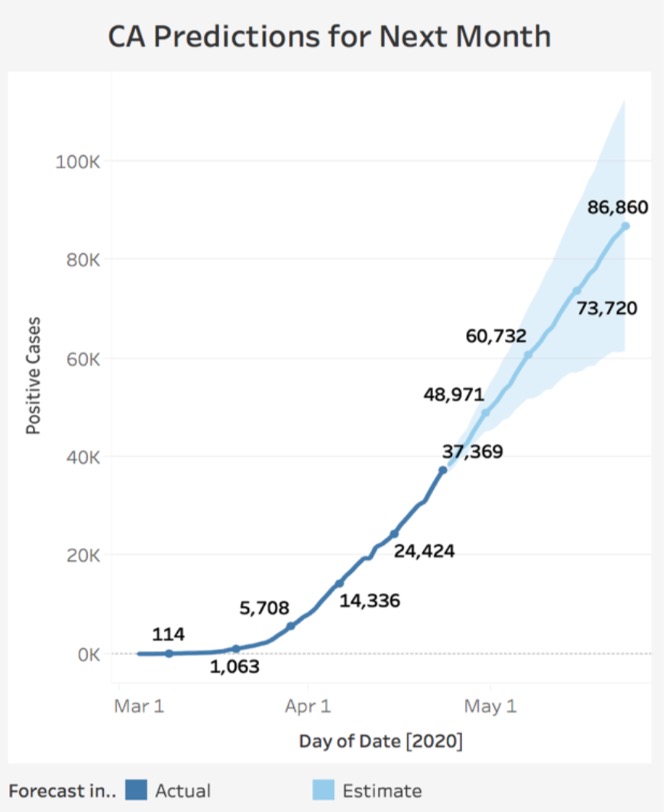
The first round of the competition tasked competitors with providing information to hypothetical California state decision makers on COVID-19 policy by creating visual representations of big data.
Koos explained that “the competition was designed to be open-ended enough that formal data analytics training is not a necessity but still allow students to showcase the full extent of their skills.”
The judging was performed by a panel of four professors and industry advisors who were looking for well-designed dashboards of visuals that could allow non-engineers to intuitively ascertain useful information for decision making. The top three scorers were Karina Camp, Peyton Ulrich, and Yoav Levanoni.
Camp, a 3rd year Industrial Engineering major with a minor in Actuarial Preparation, said “Furthering my knowledge was one major reason for participating in this competition. I am very familiar with many data analytics platforms, but had not used Tableau much before this, so I learned a new, very valuable skill.” Tableau is a business intelligence tool known for its usefulness in data visualization. A video overview of Camp’s winning submission is available here.
Numerous entries utilized dynamic visuals, with some even including webpages to display the visual dashboards. The three winning reports can be found here.
Roy Jafari, a professor of data analytics in the IME department serves as an advisor to the data analytics technicians. He stated that “we had many good submissions that showed meaningful levels of complexity and effective visualizations. However, what I am most impressed with is that IME students showed the spirit that an opportunity to learn should not be wasted. It is heartwarming to see IME students are willing to challenge themselves to apply what they have learned in their courses and further their skillsets by engaging with a new problem and even new software platforms.”
With the first round complete and declared a success, Hubred and Koos are currently preparing a second round to begin later in May. This next competition will focus on optimization rather than visualization, but still require students to find and present a story for decision making from big data.